Database
Database Performance Metrics that Matter

Database performance is a critical factor in the success of modern software systems. Whether you are running a small desktop application, a business-critical enterprise system, or a high-traffic cloud-based platform, the speed, reliability, and efficiency of your database directly affect user experience, operational costs, and scalability. Database performance can be measured using a number of different key performance indicators (KPIs). Importantly, these indicators are largely the same regardless of the underlying database platform, whether you are using a traditional relational database like SQL Server or MySQL, a NoSQL system like MongoDB, or a distributed database such as Apache Cassandra.
The main database performance testing metrics include throughput, response time (latency), concurrency or connection handling, and error rates. By examining all of these metrics together rather than in isolation, you gain a comprehensive picture of how your database is behaving under real-world conditions. Understanding these metrics allows you to identify bottlenecks, prioritize optimization efforts, and make informed decisions about scaling, refactoring, or redesigning your database architecture.
Throughput measures the amount of data or number of operations a database can process within a given period of time. Response time, often referred to as latency, is the time it takes for a database operation to complete and return results to the requester. Database connections measure how many clients can be simultaneously connected and actively interacting with the database. Error rate reflects the frequency of failures, crashes, or rejected operations over a defined period. When these metrics are evaluated together, they provide meaningful insight into overall system health and performance.
For example, a database might show excellent throughput but poor response times, indicating that while it can process many requests, individual users may experience delays. Alternatively, low error rates with limited concurrency might suggest stability but poor scalability. Each metric tells part of the story, and understanding how they interact is essential for effective performance tuning.
What’s Involved in a Database Call
Before you can improve database performance, it helps to understand exactly what happens during a database request. A database call is more than just running a query; it involves multiple steps that span the application, network, and database engine itself. If you are communicating with a remote database, all of the following steps typically occur before a response is returned:
- A connection to the database is opened using a database driver.
- A pipeline is established between TCP sockets on the client machine and the database server and added to the connection pool.
- The client sends a request (for example, a SQL query) through the pipeline.
- The database engine receives the request, parses it, optimizes it, and executes it.
- The result set is transmitted back to the client through the same pipeline.
- The database connection and pipeline are either closed or returned to the pool.
Among these steps, database processing time is usually the most significant contributor to latency. Network transfer time can also be substantial, especially when large result sets are involved or when the database is geographically distant from the client. However, in most cases, the most effective way to improve performance is to optimize how quickly the database engine processes requests.
Connection management is another important factor. Opening and closing database connections repeatedly can be expensive. This is why most modern systems use connection pooling, which reuses existing connections to reduce overhead. Poorly configured connection pools can lead to resource exhaustion, increased latency, and failed requests, even if the database itself is otherwise well-optimized.
Key Database Performance Metrics Explained
To meaningfully measure and improve database performance, it is important to clearly define and understand the core metrics involved.
Throughput refers to the volume of work a database can handle in a given time frame. This may be measured as transactions per second (TPS), queries per second (QPS), or rows processed per second. High throughput is especially important for systems that handle large numbers of concurrent users or background processes.
Response Time (Latency) measures how long it takes for a single database operation to complete. This includes query parsing, execution, and result delivery. Low latency is crucial for user-facing applications, where delays of even a few hundred milliseconds can negatively impact usability.
Concurrency and Connections describe how many clients can interact with the database simultaneously without performance degradation. This metric is influenced by hardware resources, database configuration, locking strategies, and query design.
Error Rate tracks the frequency of failed operations. Errors may result from timeouts, deadlocks, resource exhaustion, or software faults. Even a small increase in error rate can indicate serious underlying issues that warrant investigation.
Resource Utilization includes CPU usage, memory consumption, disk I/O, and network bandwidth. While not performance metrics on their own, these indicators provide valuable context for interpreting throughput and latency data.
Improving Database Throughput and Response Times
There are three primary approaches to improving database throughput and reducing response times. The first is to enhance the underlying hardware. Faster CPUs, additional memory, and high-performance storage such as solid-state drives can significantly improve database performance. Increasing network bandwidth can also reduce latency when communicating with remote databases.
The second approach involves scaling resources in cloud environments. Platforms such as Microsoft Azure, Amazon Web Services (AWS), and Google Cloud allow you to scale database resources up or down through management consoles or automated policies. Services like Amazon DynamoDB and Microsoft Cosmos DB are designed for elastic scalability, enabling high throughput under variable workloads.
However, scaling hardware or cloud resources can be expensive, and it often masks underlying design inefficiencies. Blindly adding resources without addressing query design, indexing, and schema structure may result in diminishing returns. In some cases, performance improvements may be minimal despite substantial cost increases.
The third and often most effective approach is optimization at the database design and query level. Proper indexing is one of the simplest and most impactful optimizations. Indexes allow the database engine to locate data quickly without scanning entire tables.
For example, consider a table that stores names and phone numbers, with the name defined as the primary index. If users frequently search by phone number rather than name, performance may suffer. Adding an index on the phone number column can dramatically reduce query execution time. The trade-off is increased memory usage and slightly slower write operations, but in many cases, the performance gains outweigh these costs.
Query optimization is equally important. Well-written queries that leverage indexes, avoid unnecessary joins, and limit result sets can significantly improve response times. Joining tables efficiently within a single query is often faster than executing multiple queries and combining results in application code.
Refactoring Your Database
In some cases, performance issues stem from fundamental problems in how data is structured. Refactoring your database involves modifying its schema to better align with usage patterns and business requirements. This may include changing primary keys, redefining relationships, or splitting large tables into smaller, more focused ones.
Normalization is a key refactoring technique. By organizing data to minimize duplication, normalization reduces storage requirements and improves consistency. When the same data is stored in multiple places, updates become more expensive and error-prone. Normalized designs ensure that each piece of information is stored once and referenced as needed.
However, over-normalization can sometimes hurt performance, especially in read-heavy systems. In such cases, selective denormalization—intentionally duplicating certain data—may improve query speed at the cost of increased complexity. The optimal balance depends on your workload and performance goals.
Refactoring can be time-consuming and risky, particularly for large databases with significant amounts of existing data. Careful planning, testing, and migration strategies are essential. Despite the effort involved, the long-term performance and maintainability benefits often justify the investment.
Improving Database Performance Through Caching
Caching is a powerful technique for improving database performance by storing frequently accessed data in fast memory. When a query result is cached, subsequent requests can be served directly from the cache rather than hitting the database, reducing latency and load.
Caches may exist at multiple levels, including application-level caches, database-level caches, and external caching systems such as Redis or Memcached. Effective caching requires careful analysis to determine which data should be cached and how long it should remain valid.
Key metrics such as cache hit ratio—the percentage of requests served from cache—help assess cache effectiveness. Poorly configured caches can waste memory or serve stale data, so expertise is often required to implement caching correctly.
Improving Performance Through Replication
For large-scale or enterprise-level systems, replication is another strategy for improving performance and availability. Replication involves maintaining multiple copies of a database across different servers. Read requests can be distributed among replicas using load balancers, reducing the load on any single instance.
This approach is particularly effective when the majority of database operations are reads rather than writes. However, replication introduces complexity, as updates must be propagated to all replicas. Ensuring data consistency and handling replication lag can be challenging.

Replication architectures can become complex and costly, requiring sophisticated monitoring and management. Organizations should consider replication only after optimizing queries, indexes, caching, and schema design.
Data Compression and Archiving
Data compression reduces storage requirements by encoding data more efficiently. While compressed data occupies less space and may reduce disk I/O, it requires additional CPU resources to decompress during access. Whether compression improves performance depends on the balance between I/O savings and computational overhead.
Archiving is another effective strategy for performance improvement. By moving infrequently accessed historical data out of the primary database, you reduce table sizes and index complexity. Smaller datasets generally result in faster queries and simpler maintenance.
Archiving strategies should be guided by business requirements, regulatory constraints, and access patterns. Archived data should remain accessible when needed, but it does not need to reside in the primary transactional database.
Monitoring and Continuous Performance Tuning
Database performance optimization is not a one-time activity. Continuous monitoring is essential to detect changes in workload, usage patterns, and system behavior. Performance metrics should be collected, analyzed, and reviewed regularly.
Monitoring tools can provide real-time dashboards, alerts, and historical trends. These insights enable proactive tuning and capacity planning, helping you address issues before they impact users.
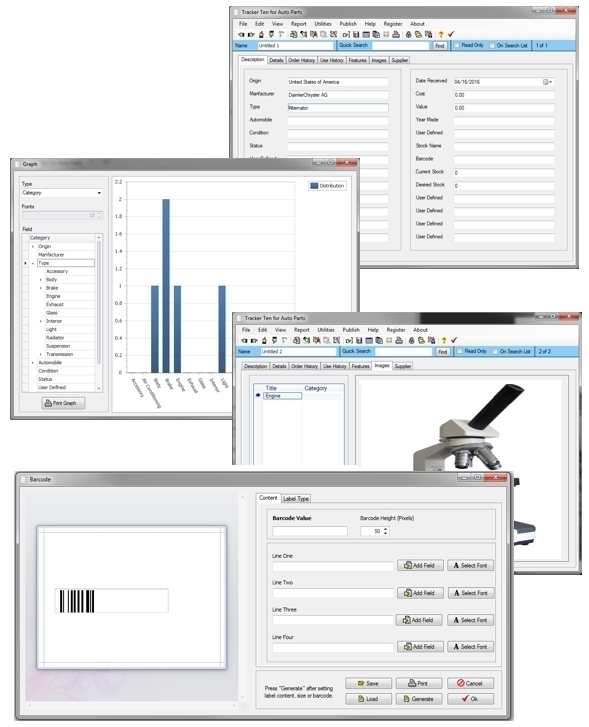
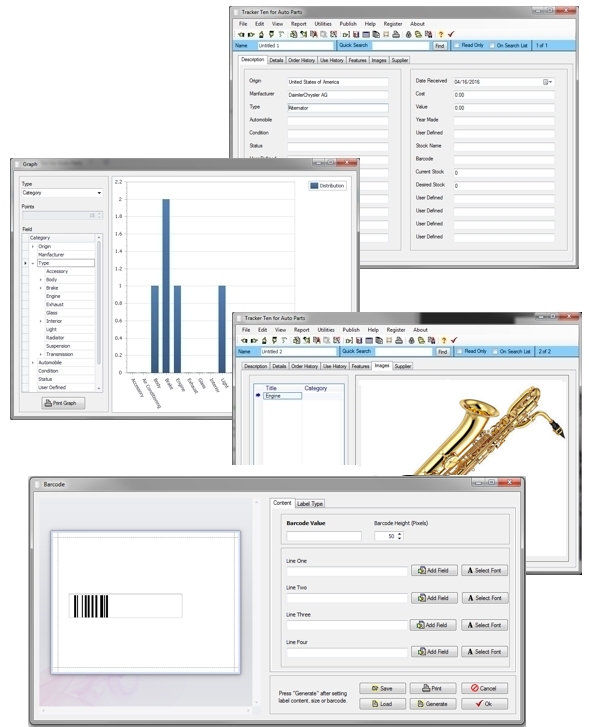
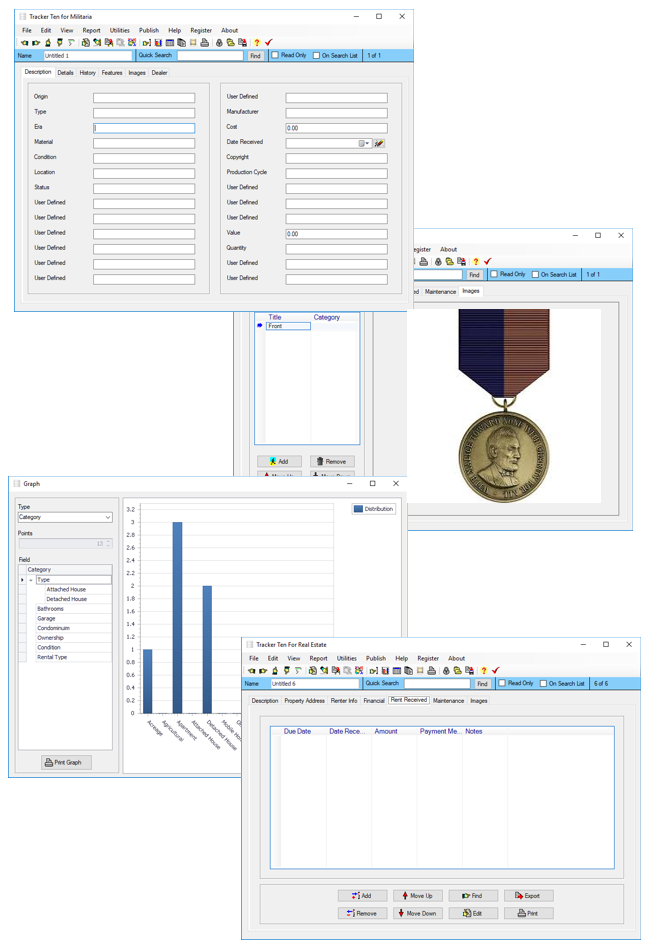
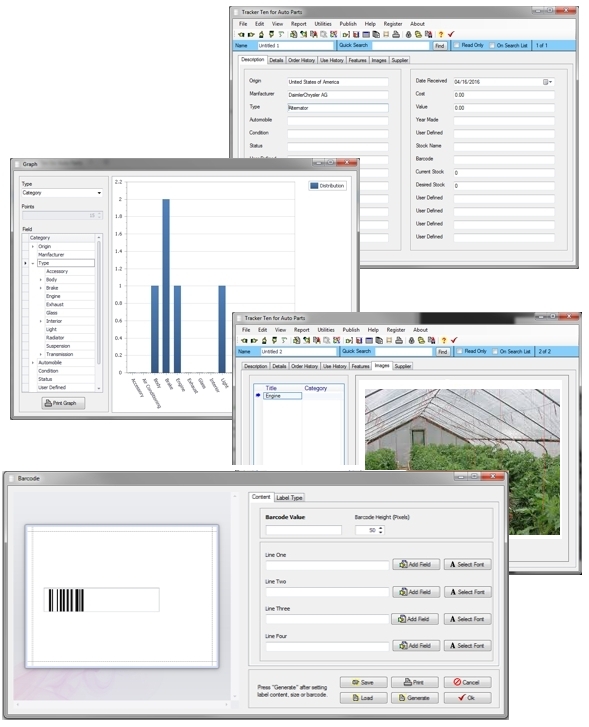
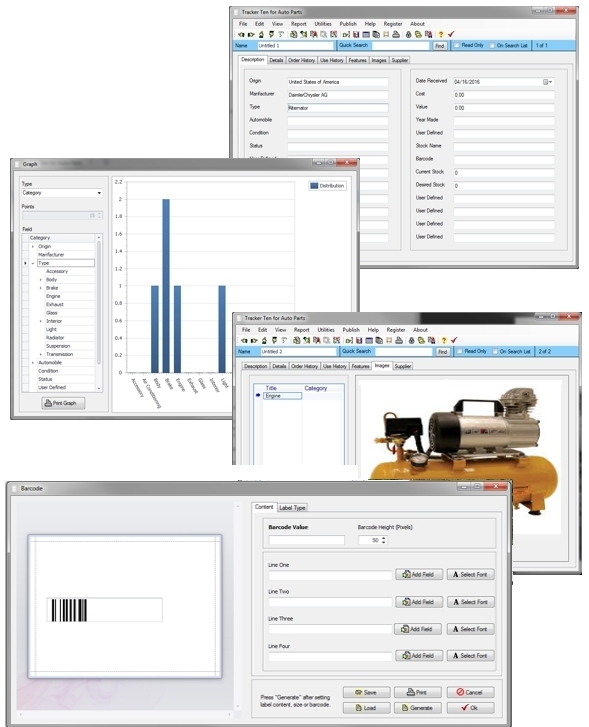
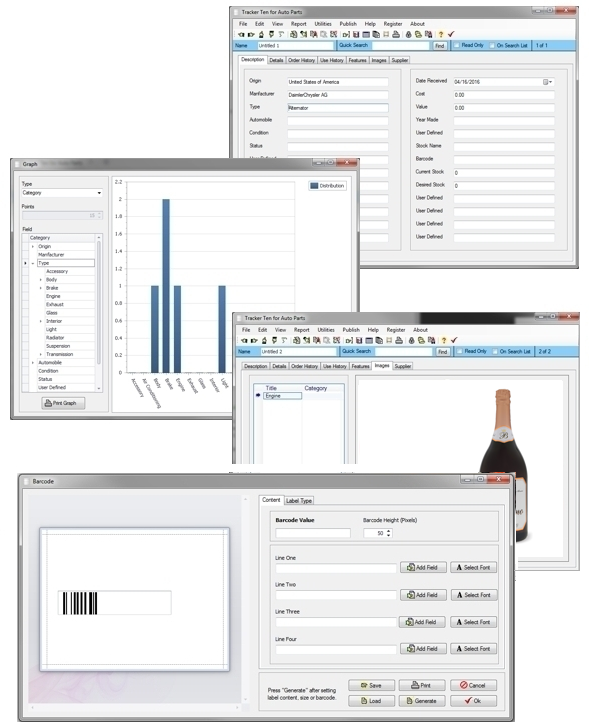
Tracker Ten
If you are looking for a desktop database application that runs entirely on your local computer, consider the Tracker Ten Windows database system. Tracker Ten is designed to handle database optimization, memory management, and throughput considerations automatically. This allows you to focus on your home or business application rather than the underlying database technology.
By understanding and applying the database performance metrics that matter, you can build systems that are faster, more reliable, and more scalable. Whether you are managing a small dataset or a large enterprise system, performance-aware design and continuous optimization are key to long-term success.
Looking for windows database software? Try Tracker Ten
- PREVIOUS Antique Collecting Friday, February 14, 2025
- NextCraft Supply Tracking Database Software Monday, January 13, 2025